Code
library(DataExplorer)
df = read.csv("data/raw/NYPD_Shooting_Incident_Data.csv")
df[df == ""] <- NA
plot_missing(df, title = "Distribution of Missing Values for Each Variable")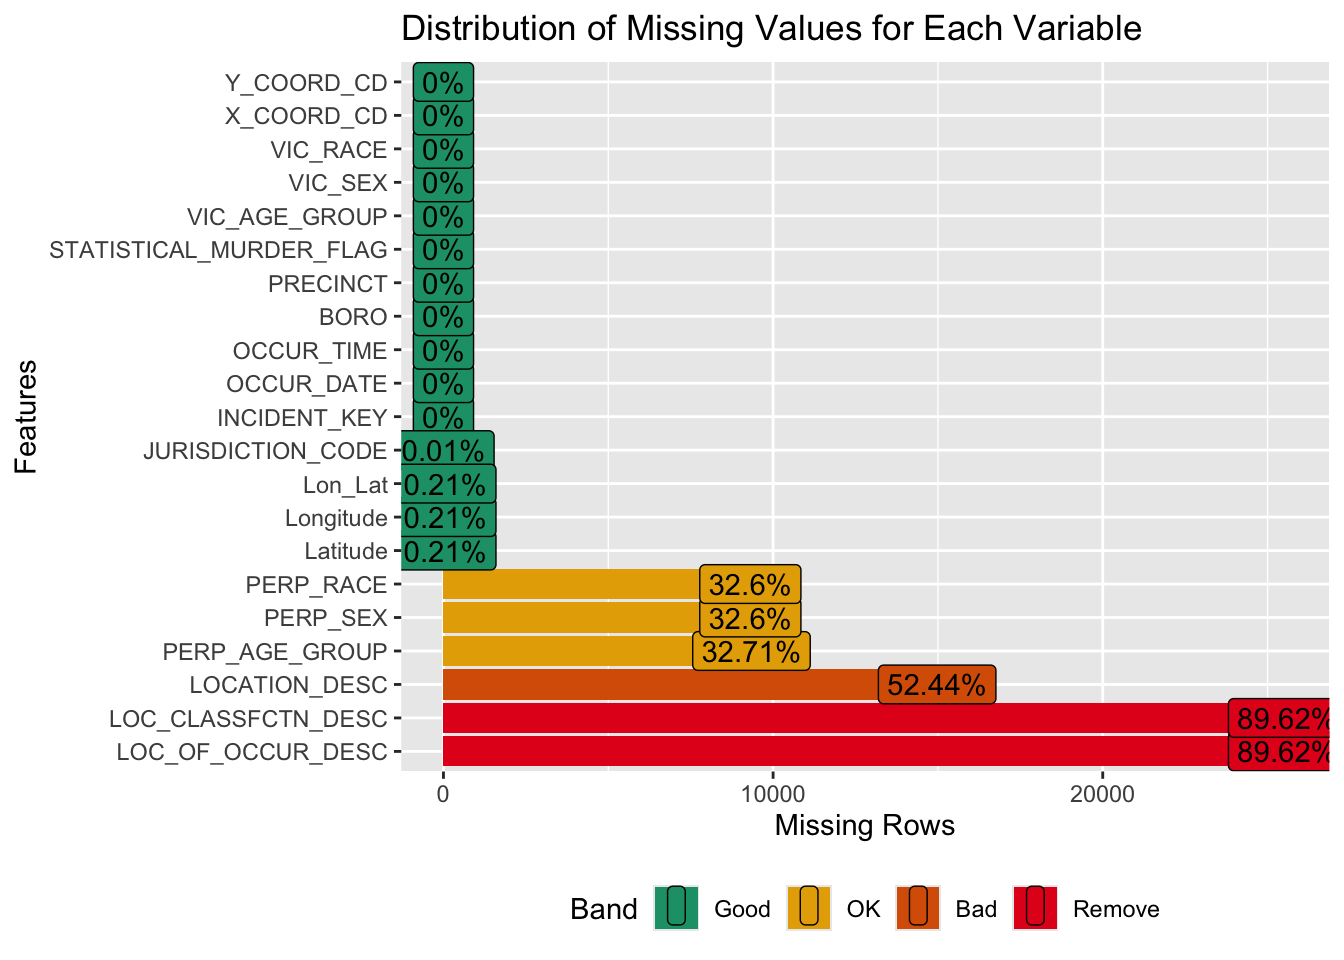
For this project, we take advantage of a dataset recording each shooting incident in NYC from 2006 to 2023. The data is collected quarterly by New York Police Department (NYPD) and reviewed by the Office of Management Analysis and Planning before being published on the NYPD website. This dataset is updated annually. It contains 28562 rows and 21 columns, with each row representing a single shooting incident. The 21 columns provide detailed information about each incident, such as the location, time, and details about the suspect and victim. This dataset is available in multiple formats, including CSV, XML, etc. For this project, we imported the data by downloading it in CSV format from the website “https://data.cityofnewyork.us/Public-Safety/NYPD-Shooting-Incident-Data-Historic-/833y-fsy8/about_data”.
library(DataExplorer)
df = read.csv("data/raw/NYPD_Shooting_Incident_Data.csv")
df[df == ""] <- NA
plot_missing(df, title = "Distribution of Missing Values for Each Variable")
From the plot “Distribution of Missing Values for Each Variable”, we can see that 16 columns contain either no missing values or very small number of missing values. Each of the columns PERP_RACE, PERP_SEX, and PERP_AGE_GROUP contains about 32.5% missing values. These columns record information about perpetrators. About a half of values are missing in LOCATION_DESC, which records the location of the shooting incident. Finally, the columns LOC_CLASSFCTN_DESC and LOC_OF_OCCUR_DESC both contain 89.62% missing values. LOC_CLASSFCTN_DESC is a column showing whether the incident is outdoor or indoor. LOC_CLASSFCTN_DESC is a column showing whether the kind of location of the shooting incident (e.g. commercial, street, housing, vehicle, etc.)
library(naniar)
library(patchwork)
# https://www.rdocumentation.org/packages/naniar/versions/1.1.0/topics/gg_miss_upset
gg_miss_upset(df, nsets = 10)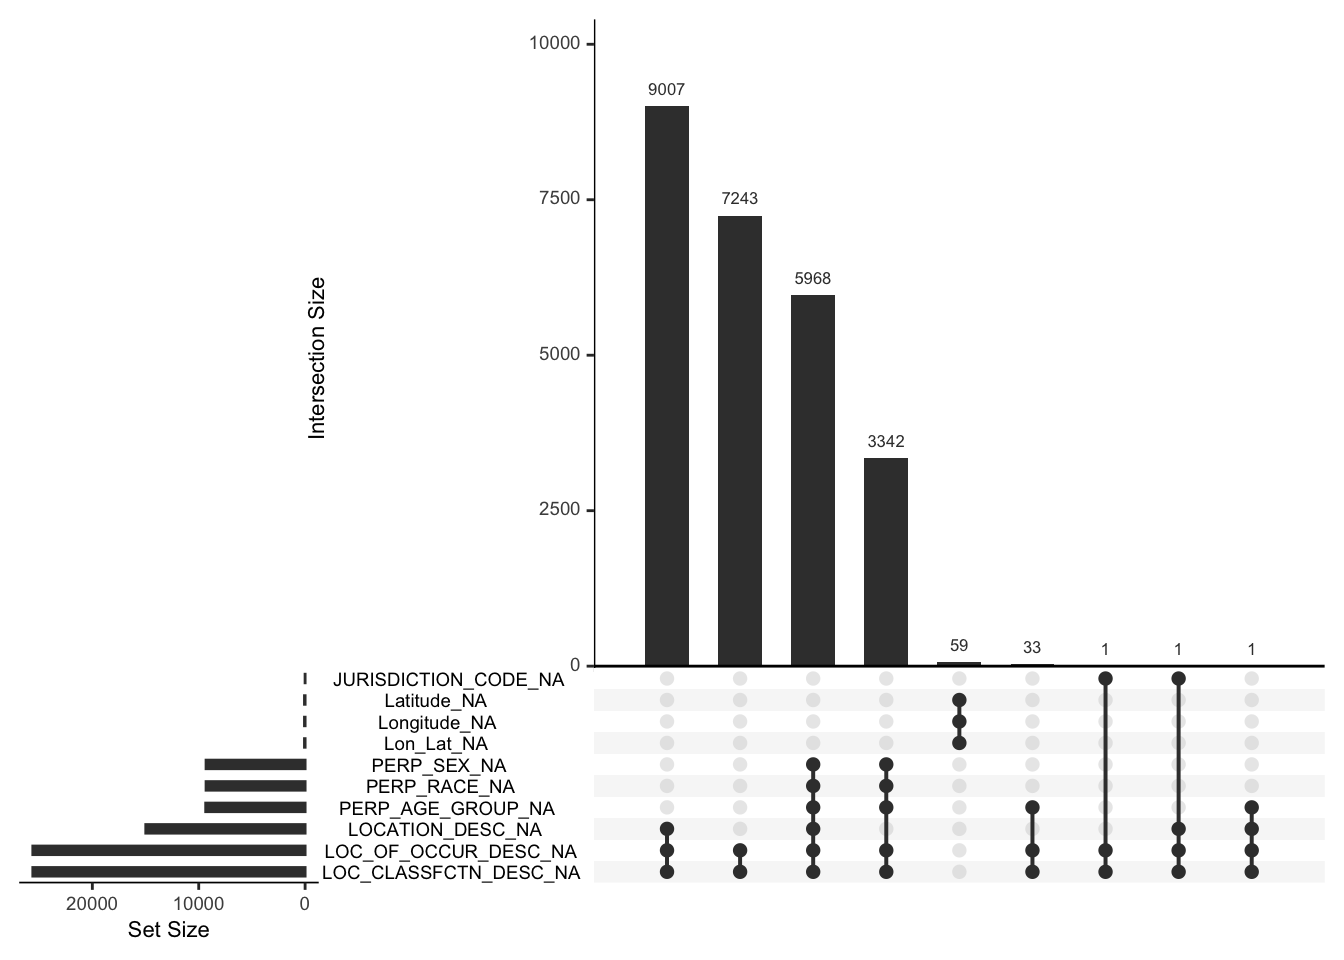
The plot above shows the intersection of missing values among multiple variables. It shows that all of the missing values in the columns LOC_OF_OCCUR_DESC and LOC_CLASSFCTN_DESC appear together (the number of missing values in these two columns: \(28562 \times 0.8962 \approx 25597\) and the sum of the frequencies of the bins except the 5th bin above is 25596). Except the 59 intersection of missing values in the columns “Latitude, Longitude, and Lon_Lat”, all intersections include these two columns.
In addition, it shows that all of the missing values in the three columns Latitude, Longitude, and Lon_Lat appear at the same time (i.e. one column has a missing value only when other two columns also have missing values) since the plot “Distribution of Missing Values for Each Variable” shows each of them has only \(28562 \times 0.21\% \approx 59\) missing values.
Similarly, all of the missing values in the columns PERP_SEX and PERP_RACE appear at the same time. This is because the plot “Distribution of Missing Values for Each Variable” shows each of them has only \(28562 \times 0.326 \approx 9311\) and the sum of the frequency of the third column and the fourth column is 9310. Notice that if these two columns’ missing values appear, the value of the column PERP_AGE_GROUP is also missing, but not the other way around (PERP_AGE_GROUP has around 1285 additional missing values that only accompany with the missing values of the columns LOC_OF_OCCUR_DESC and LOC_CLASSFCTN_DESC).